Please see attached letter.
Chapter 2: Core Strategy
Dúnta31 Bea, 2021, 09:00 - 29 Mei, 2021, 16:00
| Amendment No.: | Proposed Amendment Chapter 2.1 |
| Submission/ NOM/ (FTF) NOM Numbers |
MH-C5-60 |
| Chapter/Section |
Section 2.4.2.4 |
| Proposed Material Amendment | |
|
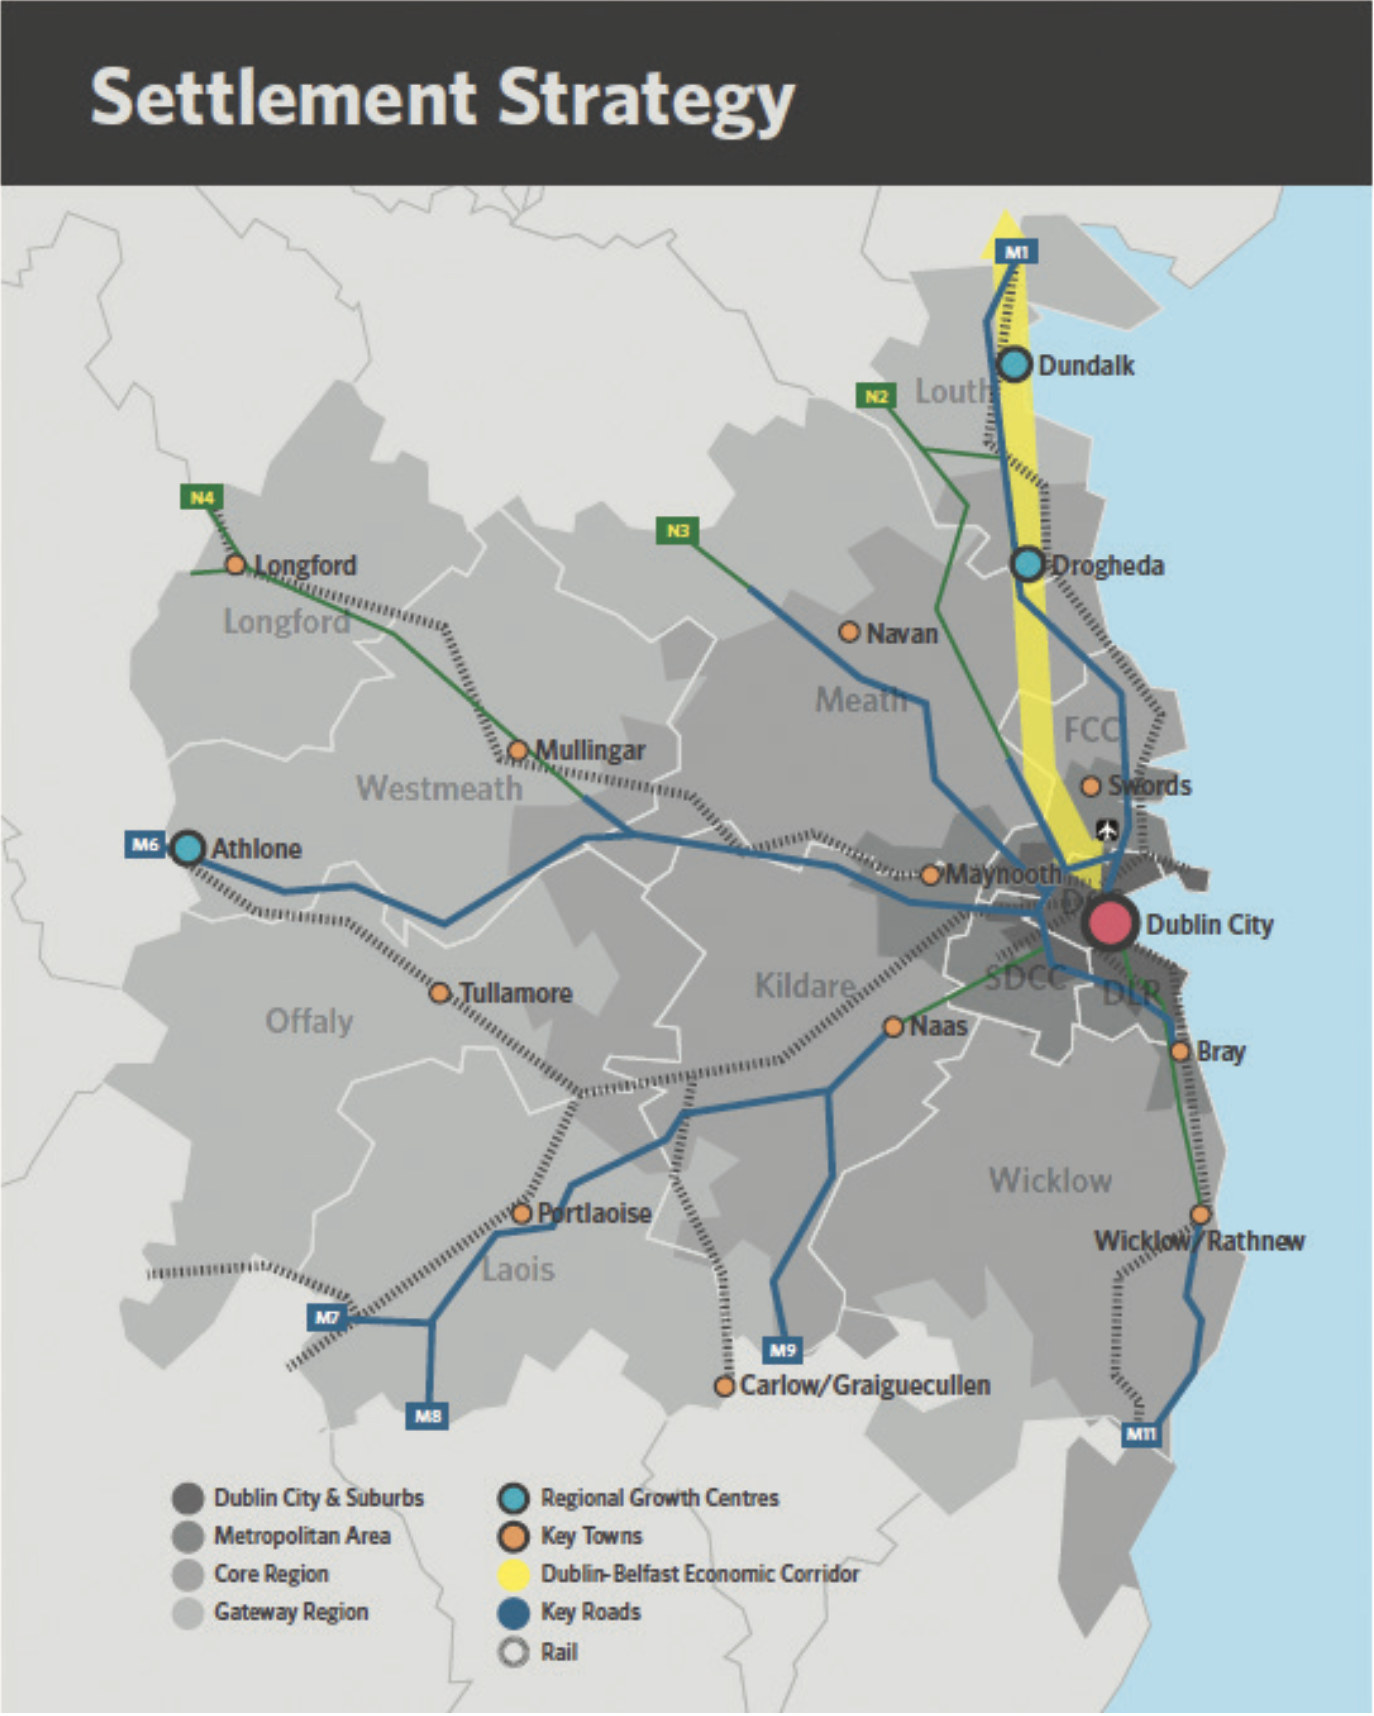
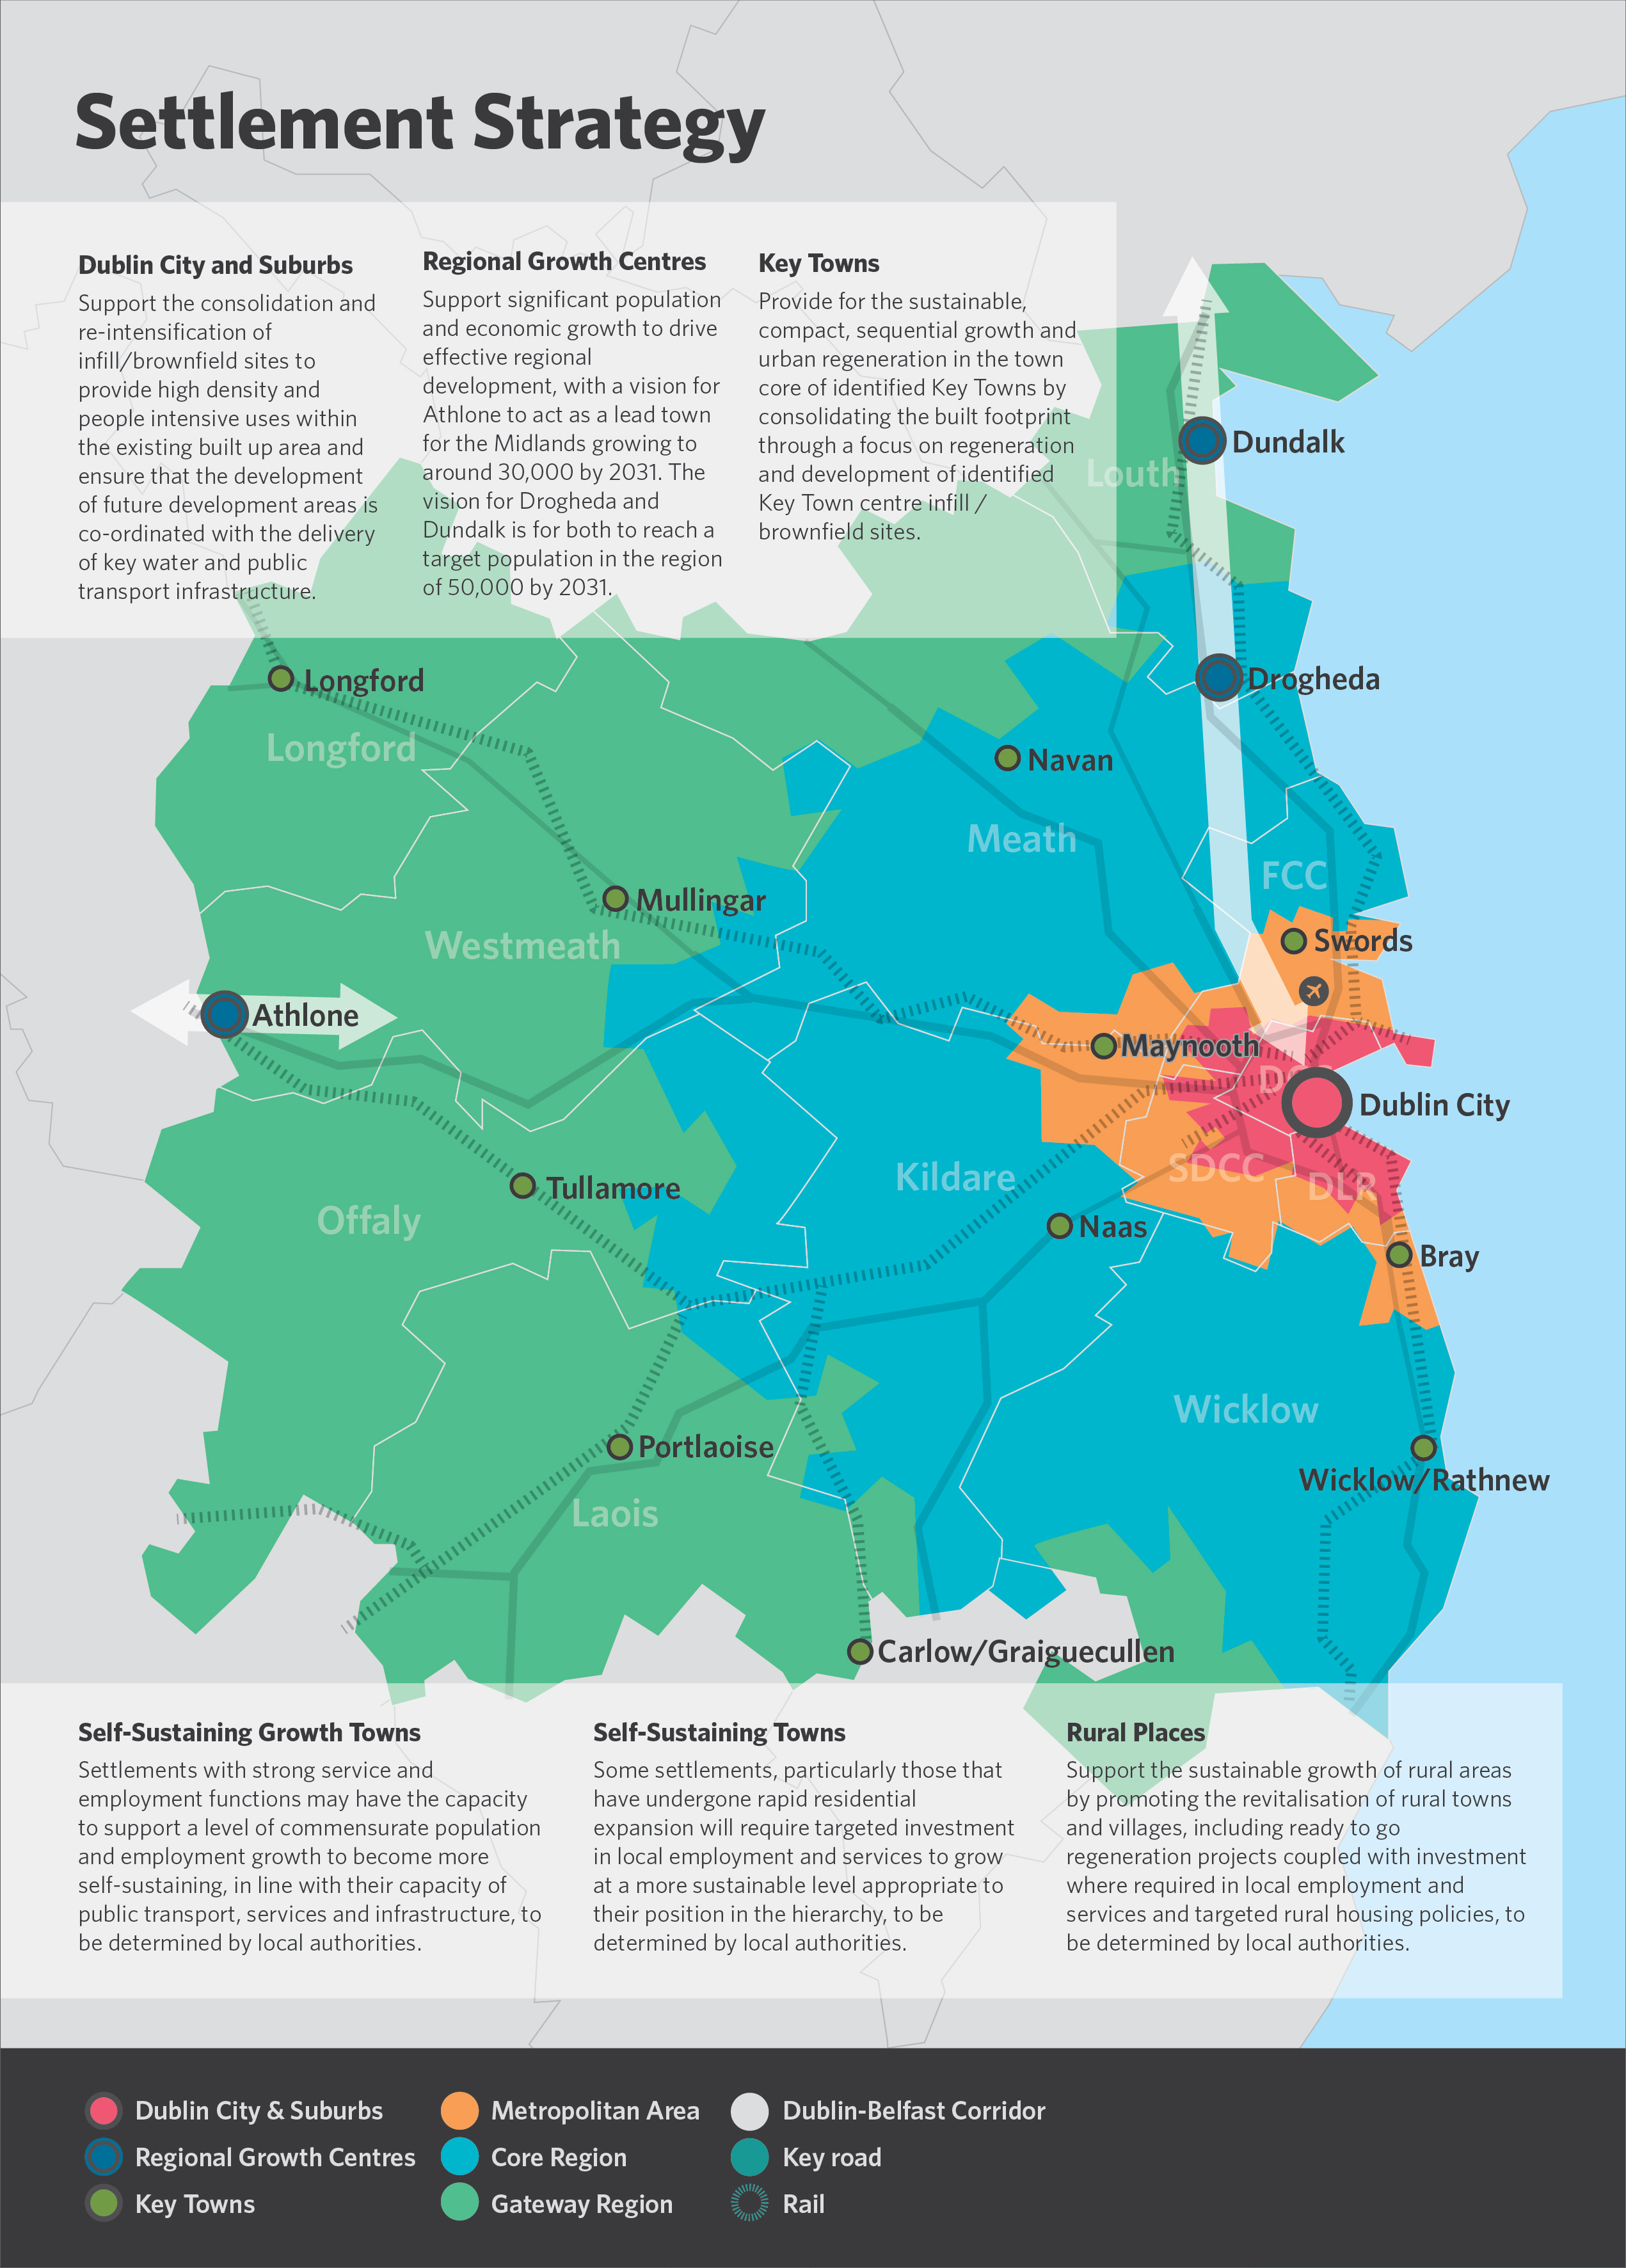
Section 2.4.2.4 ‘Economic Strategy’ - Change to Map 2.1 Policy Areas in the Eastern and Midland Region to include updated version produced by EMRA as follows:
Map 2.1 Policy Areas in the Eastern and Midland Region
Proposed Change |
|
| Amendment No.: | Proposed Amendment Chapter 2.2 |
| Submission/ NOM/ (FTF) NOM Numbers |
MH-C5-816 |
| Chapter/Section |
Section 2.4.3 |
| Proposed Material Amendment | |
|
Amend Table 2.3: ‘Settlement Hierarchy for Meath’ in Section 2.4.3 ‘The influence of the RSES on shaping future growth in Meath’ as follows:
Clonee designated as a Rural Village as opposed to ‘Towns & Villages’ |
|
Table 2.3 Settlement Hierarchy for Meath
|
Settlement Typology |
Description |
Location |
|
Dublin City and Metropolitan Area |
International business core with a highly concentrated and diversified employment base and higher order retail, arts, culture and leisure offer. Acts as national transport hub with strong inter and intra-regional connections and an extensive commuter catchment. |
Dublin City and suburbs Dunboyne/Dunboyne North/ Clonee Maynooth Kilcock |
|
Regional Growth Centres |
These are large towns with a high level of self- sustaining employment and services that act as regional economic drivers and play a significant role for a wide catchment area. |
Drogheda |
|
Key Towns |
Large economically active service and/or county towns that provide employment for their surrounding areas and with high quality transport links and the capacity to act as growth drivers to complement the Regional Growth Centres. |
Navan, Maynooth |
|
Self-Sustaining Growth Towns |
Towns with a moderate level of jobs and services – includes sub-county market and commuter towns with good transport links and capacity for continued commensurate growth to become more self- sustaining. |
Ashbourne, Dunshaughlin, Kells, Trim, Dunboyne/ Dunboyne North |
|
Self-Sustaining Towns |
Towns with high levels of population growth and a weak employment base which are reliant with other areas for employment and/or services and which require targeted ‘catch-up’ investment to become more self-sustaining. |
Laytown Bettystown- Mornington-Donacarney, Ratoath, Enfield, Stamullen, Kilcock, Duleek |
|
Towns and Villages |
Towns and villages with local service and employment functions |
Towns – Athboy, Oldcastle,
|
|
Rural |
Rural villages less than 1,500 and the wider rural region |
Carlanstown, Carnaross, Clonard, Clonee, Crossakiel, Donore, Drumconrath, Gibbstown, Gormanstown, Julianstown, Kentstown, Kilbride, Kildalkey, Kilmainhamwood, Kilmessan, Moynalty, Nobber, Rathcairn, Rathmolyon, Slane, Summerhill |
| Amendment No.: | Proposed Amendment Chapter 2.3 |
| Submission/ NOM/ (FTF) NOM Numbers |
MH-C5-816 |
| Chapter/Section |
Section 2.5 Core Strategy Map |
| Proposed Material Amendment | |
|
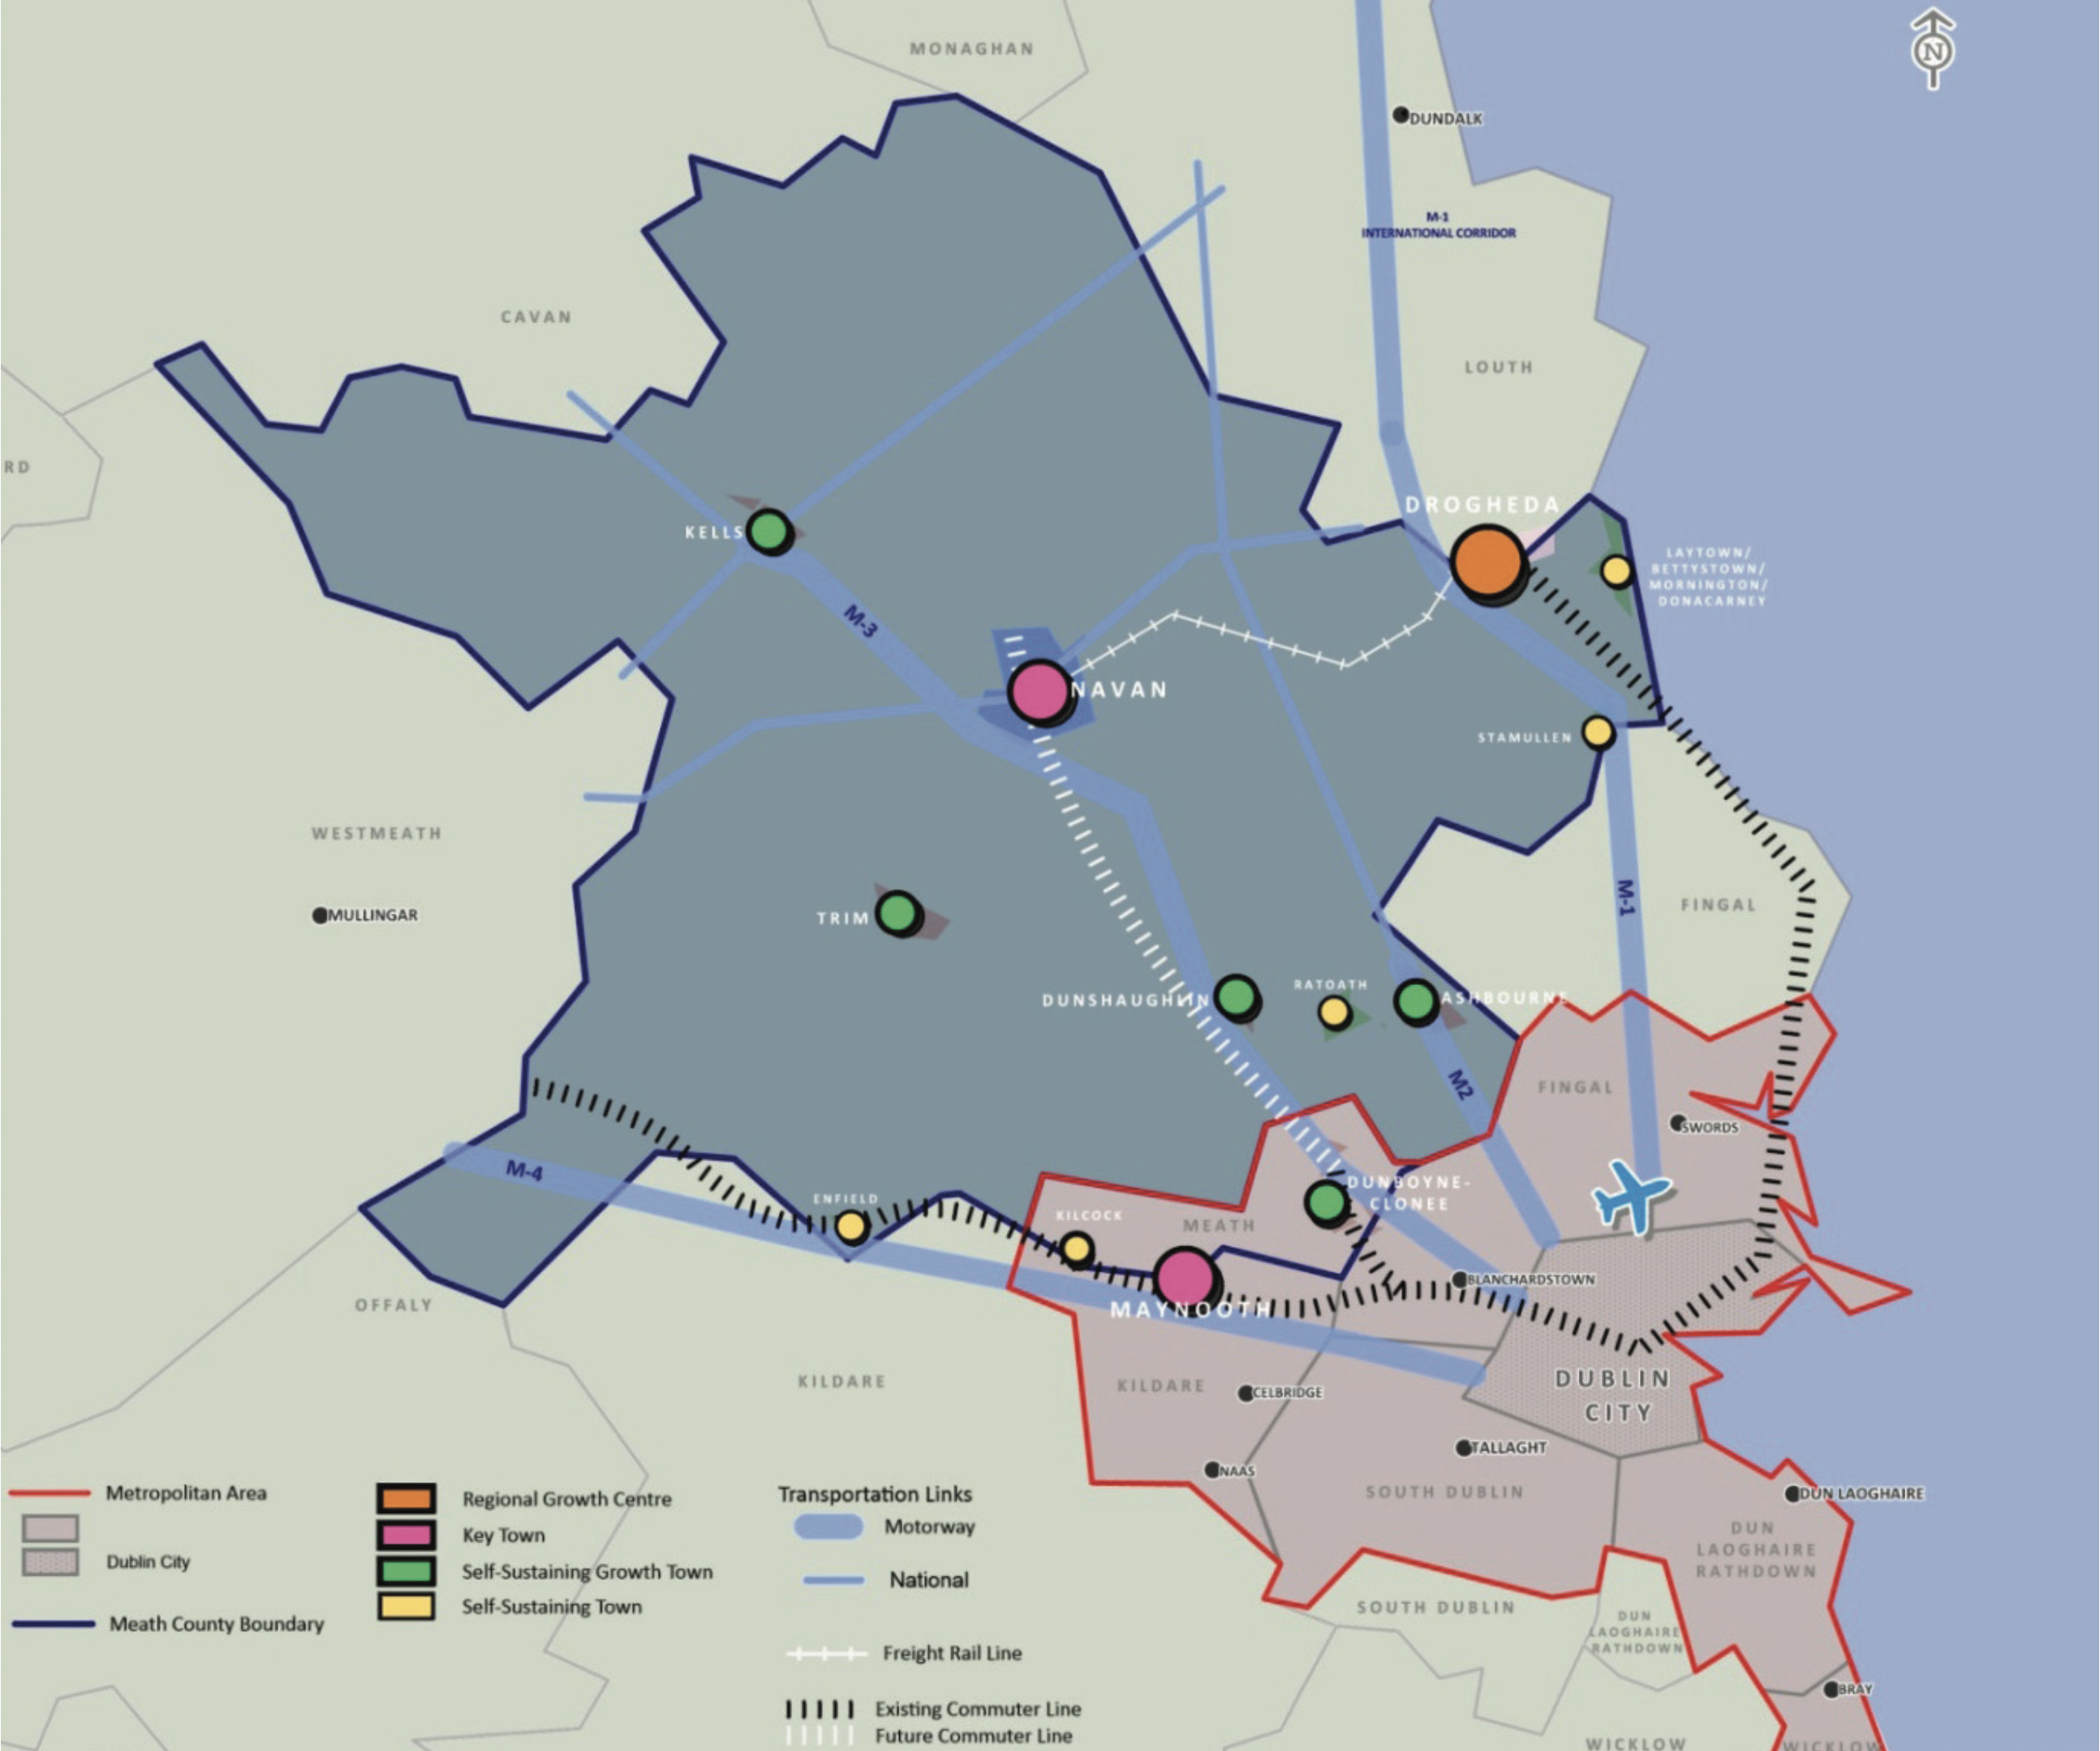
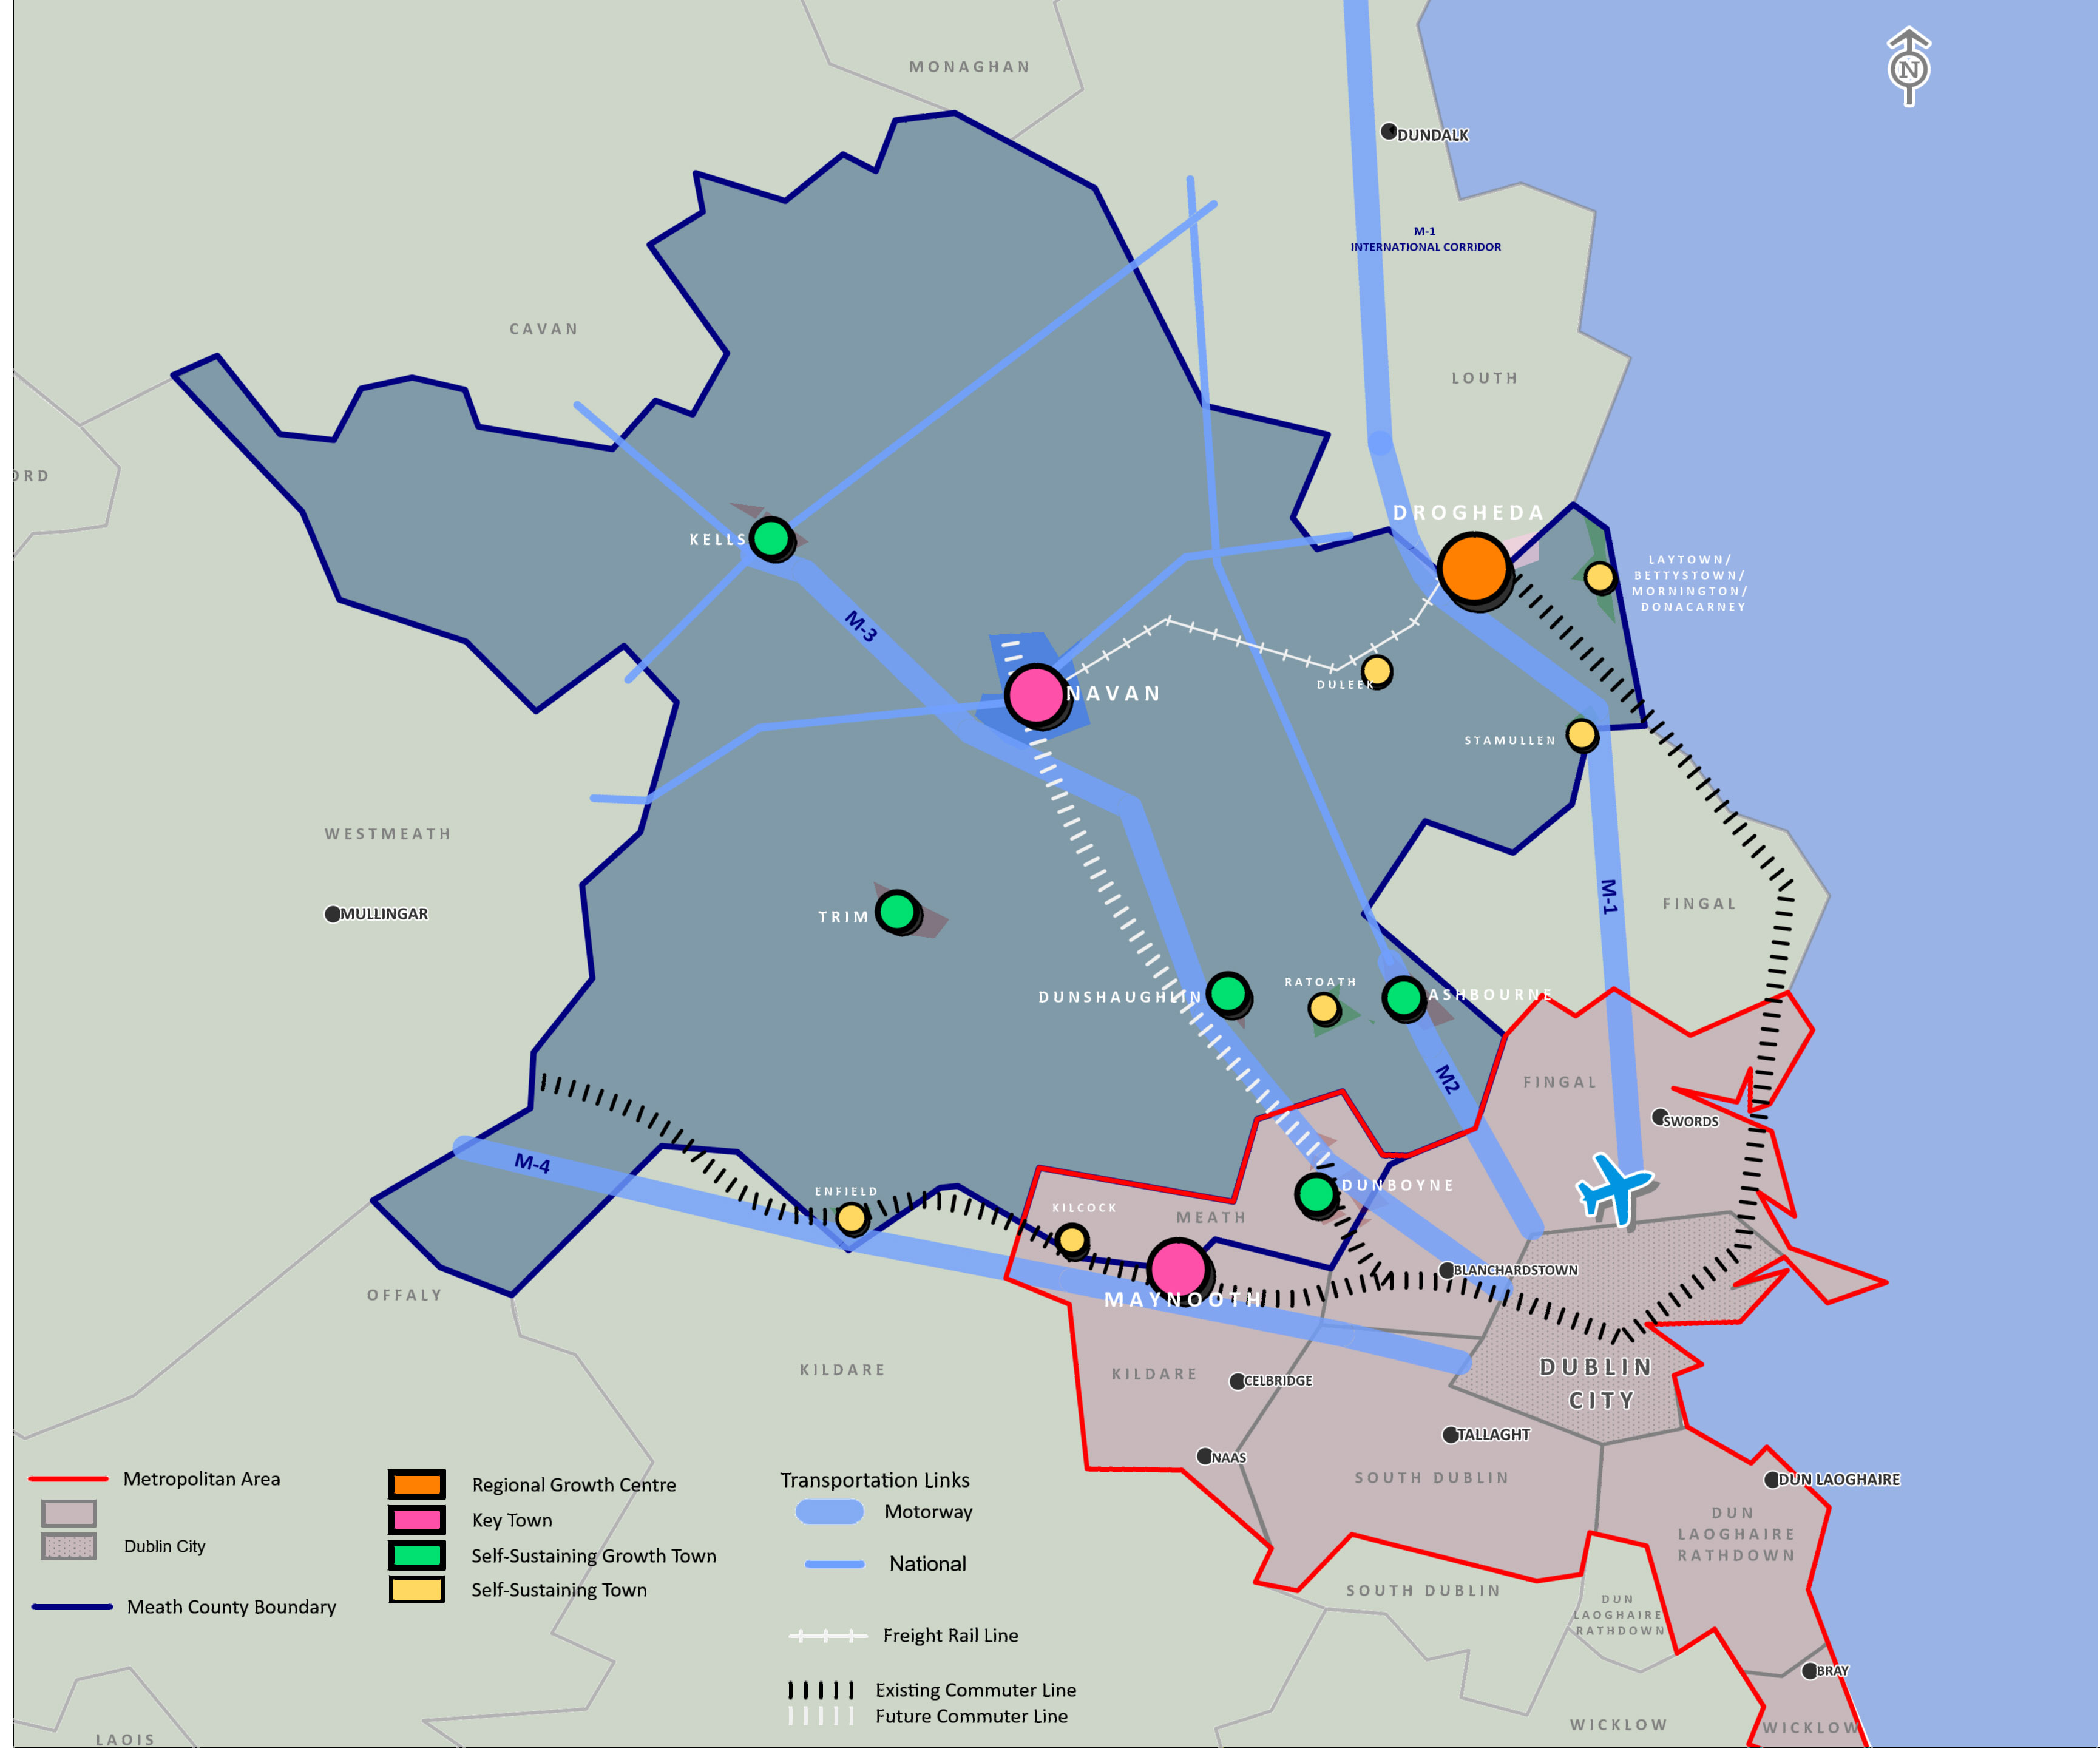
Amend Map 2.3 Core Strategy Map in section 2.5 ‘Core Strategy Map’ to show the changes as per Table 2.3 detailed above
- Identification of Duleek as a self sustaining town on this map
Draft Plan
Proposed Changes |
|
| Amendment No.: | Proposed Amendment Chapter 2.4 |
| Submission/ NOM/ (FTF) NOM Numbers |
MH-C5-381 |
| Chapter/Section |
Section 2.8.1.1 |
| Proposed Material Amendment | |
|
Remove the term ‘transitional arrangement’ from the last paragraph of Section 2.8.1.1 ‘Joint Urban Area Plan for Drogheda’ (body text) –
‘This ‘ |
|
| Amendment No.: | Proposed Amendment Chapter 2.5 |
| Submission/ NOM/ (FTF) NOM Numbers |
MH-C5-816 |
| Chapter/Section |
Section 2.8.2 |
| Proposed Material Amendment | |
|
Amend Section 2.8.2 ‘Population Projections’ under Table 2.6 with the following body text: The population projection for Meath is therefore 227,500 in 2026. The difference between the projected 2026 population for the county and the projected 2031 population is 4,000. When this growth is divided across the five-year period, it results in an annual increase of 800 people per year. This results in the population projection for Meath being 228,300 in 2027 (with population figures to be reviewed on the publication of the 2022 census). The consequent additional population for 2027 has been directed into Navan as this reflects the County Town and Key Town status of this settlement. Changes to Table 2.11 ‘Core Strategy Table as follows:
- Accommodate additional population (for 2027) The amendments to this table shall be reflected across the different sections of the development plan as required. |
|
Table 2.11 Core Strategy Table from the Draft Plan
|
|
|
|
|
|
|
|
|
|
|
|
|
|
|
|
|
|
|
|
|
|
|
|
|
|
|
|
|
|
|
|
|
|
|
|
|
|
|
|
|
|
||||||||
|
|
||||||||
|
|
|
|
|
|
|
|
|
|
|
|
|
|
|
|
|
|
|
|
|
|
|
|
|
|
|
|
|
|
|
|
||||||||
|
|
|
|
|
|
|
|
|
|
|
|
|
|
|
|
|
|
|
|
|
|
|
|
|
|
|
|
|
|
|
|
|
|
|
|
|
|
|
|
|
|
|
|
|
|
|
|
|
|
|
|
|
|
|
|
|
|
|
|
|
|
|
|
|
|
|
|
|
|
|
|
|
|
|
|
|
|
|
|
|
|
|
|
|
|
|
|
|
|
|
|
|
|
|
|
|
|
|
|
|
|
|
|
|
|
|
|
|
|
|
|
|
|
|
|
|
|
|
|
|
|
|
|
|
|
|
|
|
|
|
|
|
|
|
|
|
|
|
|
|
|
||||||||
|
|
||||||||
|
|
|
|
|
|
|
|
|
|
|
|
|
|
|
|
|
|
|
|
|
|
|
|
|
|
|
|
|
|
|
|
|
|
|
|
|
|
|
|
|
|
||||||||
|
|
||||||||
|
|
|
|
|
|
|
|
|
|
|
|
|
|
|
|
|
|
|
|
|
|
|
|
|
|
|
|
|
|
|
|
|
|
|
|
|
|
|
|
|
|
|
|
|
|
|
|
|
|
|
|
|
|
|
|
|
|
|
|
|
|
|
|
|
|
|
|
|
|
|
|
|
|
|
|
|
|
|
|
|
|
|
|
|
|
|
|
|
|
|
|
|
|
|
|
|
|
|
|
|
|
|
|
|
|
|
|
|
|
|
|
|
|
|
|
|
|
|
|
|
|
|
|
|
|
|
|
|
|
|
|
|
|
|
|
|
|
|
|
|
|
|
|
|
|
|
|
|
|
|
|
|
|
|
|
|
|
|
|
|
|
|
|
|
|
|
|
|
|
|
|
|
|
|
|
|
|
|
|
|
|
|
|
|
|
|
|
|
|
|
|
|
|
|
|
|
|
|
|
|
|
|
|
|
|
|
|
|
|
|
|
|
|
|
|
|
|
|
|
|
|
|
|
|
|
|
|
|
|
|
|
|
|
|
|
|
|
|
|
|
|
|
|
|
|
|
|
|
|
|
|
|
|
|
|
|
|
|
|
|
|
||||||||
|
|
||||||||
|
|
|
|
|
|
|
|
|
|
|
|
|
|
|
|
|
|
|
|
Table 2.11: Core Strategy Table, Population and Household distribution to 2026
37 This figure does not include the units completed 2016-2019. The calculation of the household allocation has factored in the ‘pent up’demand for housing which has resulted in an increase in the average household occupancy rate for existing households. As the housing market continues to normalise and supply begins to meet demand it is anticipated that the average household occupancy rate for both existing and new households will begin to decrease.
38 This includes both greenfield and brownfield sites in the built up area of each settlement and consists of lands zoned for town centre, mixed use, and residential development. For clarification these units have been included in the Household allocation.
39 This does not include the 38.1ha SDZ at Clonmagadden. This SDZ will span over multiple Development Plans. Taking this into account in addition to the fact that a review of the Planning Scheme is required, the SDZ has not been included in the Household allocation for Navan.
40 Half of this population allocation (500 persons) is taken from the MASP allocation. This is provided for in section 5.7 of the Dublin MASP ‘Housing Delivery’. This is a preliminary figure, with the final figure to be agreed with the MASP Implementation Group. At the time of writing the MASP Implementation Group had not been established.
41 Under a Strategic Housing Development application permission was granted for 913 units. This is a 10 year permission where it is envisaged the lands will be developed across multiple Development Plans . Taking this into account 600 (two-thirds) of the 913 units have been included in the Household allocation during this Development Plan.
42 Includes provision for 30 no. social housing units
Draft Plan
|
Column A |
Column B |
Column C |
Column D |
Column E |
Column F |
Column G |
Column H |
Column I |
Column J |
Column K |
|
Settlement |
Population 2016 |
Projected population increase to 2027 |
Projected population 2027 |
Approximate households completed 2016-2019 |
Extant units not yet built |
Household allocation 2020-202737 |
Potential units to be delivered on infill/brown field lands38 |
Quantum of land zoned for residential use (ha) |
Quantum of land zoned for existing residential use (ha) |
Quantum of land zoned for mix of uses (ha) |
|
Regional Growth Centre |
|
|
|
|
|
|
|
|
|
|
|
Drogheda |
6,527 |
3,300 |
9,827 |
113 |
572 |
1,631 |
0 |
178.73 |
118.59 |
5.00 |
|
Key Town |
|
|
|
|
|
|
|
|
|
|
|
Navan |
30,173 |
5,900 |
36,073 |
781 |
924 |
3,204 |
1,936 |
79.6139 |
571.09 |
95.77 |
|
Maynooth |
0 |
100040 |
1000 |
0 |
0 |
500 |
0 |
21.36 |
0.19 |
0 |
|
Self Sustaining Growth Town |
|
|
|
|
|
|
|
|
|
|
|
Dunboyne |
7,272 |
3,300 |
10,572 |
48 |
119 |
2,002 |
1,180 |
72.89 |
116.97 |
26.65 |
|
Ashbourne |
12,679 |
3,200 |
15,879 |
632 |
209 |
1,349 |
351 |
31.48 |
218.21 |
18.62 |
|
Trim |
9,194 |
2,250 |
11,444 |
31 |
437 |
1,333 |
812 |
41.92 |
177.94 |
36.65 |
|
Kells |
6,135 |
1,000 |
7,135 |
48 |
391 |
452 |
400 |
19.95 |
134.81 |
24.07 |
|
Dunshaughlin |
4,035 |
2,200 |
6,235 |
470 |
1,15641 |
1,003 |
82 |
33.09 |
110.52 |
15.26 |
|
Column A |
Column B |
Column C |
Column D |
Column E |
Column F |
Column G |
Column H |
Column I |
Column J |
Column K |
|||||||||
|
Settlement |
Population 2016 |
Projected population increase to 2027 |
Projected population 2027 |
Approximate households completed 2016-2019 |
Extant units not yet built |
Household allocation 2020-202737 |
Potential units to be delivered on infill/brown field lands38 |
Quantum of land zoned for residential use (ha) |
Quantum of land zoned for existing residential use (ha) |
Quantum of land zoned for mix of uses (ha) |
|||||||||
|
Self- Sustaining Towns |
|
|
|
|
|
|
|
|
|
|
|||||||||
|
Bettystown- Laytown- Mornington East |
11,872 |
1,500 |
13,372 |
689 |
518 |
74642 |
264 |
24.56 |
288.6 |
23.47 |
|||||||||
|
Ratoath |
9,533 |
1,500 |
11,033 |
175 |
72 |
803 |
101 |
27.37 |
187.12 |
14.3 |
|||||||||
|
Duleek |
4,219 |
500 |
4,719 |
36 |
85 |
336 |
250 |
10.9 |
96.33 |
6.14 |
|||||||||
|
Enfield |
3,239 |
1,000 |
4,239 |
45 |
135 |
474 |
84 |
16.13 |
49.21 |
16.47 |
|||||||||
|
Stamullen |
3,361 |
500 |
3,861 |
1 |
215 |
290 |
58 |
11.8 |
56.07 |
8.72 |
|||||||||
|
Kilcock |
93 |
500 |
593 |
100 |
180 |
180 |
0 |
8.79 |
15.5 |
0 |
|||||||||
|
Small Towns |
|
|
|
|
|
|
|
|
|
|
|||||||||
|
Athboy |
2,445 |
350 |
2,795 |
34 |
127 |
200 |
100 |
16.37 |
56.6 |
15.12 |
|||||||||
|
Oldcastle |
1,383 |
350 |
1,733 |
16 |
0 |
166 |
110 |
9.78 |
34.51 |
13.23 |
|||||||||
|
Ballivor |
1,809 |
100 |
1,909 |
0 |
0 |
40 |
40 |
1.93 |
39.63 |
7.09 |
|||||||||
|
Longwood |
1,581 |
200 |
1,781 |
16 |
68 |
104 |
20 |
1.24 |
28.81 |
4.89 |
|||||||||
|
Villages |
10,540 |
2,025 |
12,565 |
178 |
318 |
840 |
484 |
51.46 |
280.18 |
53.34 |
|||||||||
|
Rural nodes |
68,948 |
3,125 |
72,079 |
300 |
c.300 |
1,336 |
N/A |
N/A |
N/A |
N/A |
|||||||||
|
Total |
195,044 |
33,800 |
228,800 |
3,713 |
5,820 |
16,958 |
6,272 |
659.95 |
2580.88 |
384.79 |
|||||||||
Table 2.11: Core Strategy Table, Population and Household distribution to 2027
Updates on foot of changes to Table 2.11 shall be reflected throughout Volume 1 and Volume 2 of the Draft Plan
37 This figure does not include the units completed 2016-2019. The calculation of the household allocation has factored in the ‘pent up’demand for housing which has resulted in an increase in the average household occupancy rate for existing households. As the housing market continues to normalise and supply begins to meet deman is anticipated that the average household occupancy rate for both existing and new households will begin to decrease.
38 This includes both greenfield and brownfield sites in the built up area of each settlement and consists of lands zoned for town centre, mixed use, and residential development. For clarification these units have been included in the Household allocation.
39 This does not include the 38.1ha SDZ at Clonmagadden. This SDZ will span over multiple Development Plans. Taking this into account in addition to the fact that a review of the Planning Scheme is required, the SDZ has not been included in the Household allocation for Navan.
40 Half of this population allocation (500 persons) is taken from the MASP allocation. This is provided for in section 5.7 of the Dublin MASP ‘Housing Delivery’. This is a preliminary figure, with the final figure to be agreed with the MASP Implementation Group. At the time of writing the MASP Implementation Group had not been established.
41 Under a Strategic Housing Development application permission was granted for 913 units. This is a 10 year permission where it is envisaged the lands will be developed across multiple Development Plans . Taking this into account 600 (two-thirds) of the 913 units have been included in the Household allocation during this Development Plan.
42 Includes provision for 30 no. social housing units
Proposed Plan
| Amendment No.: | Proposed Amendment Chapter 2.6 |
| Submission/ NOM/ (FTF) NOM Numbers |
MH-C5-816 |
| Chapter/Section |
Section 2.10.4 |
| Proposed Material Amendment | |
|
Amend Section 2.10.4 ‘Distribution of Population and Households’ in the County with the following body text:
Table 2.11, the ‘Core Strategy Table’, sets out the population projections and household allocation for each settlement up to |
|
| Amendment No.: | Proposed Amendment Chapter 2.7 |
| Submission/ NOM/ (FTF) NOM Numbers |
MH-C5-816 |
| Chapter/Section |
Section 2.10.4 |
| Proposed Material Amendment | |
|
It is noteworthy that the yield from mixed use developments over the 2013-2019 plan period is relatively small at approximately 128 units. It is not anticipated that the quantum of lands zoned mixed use as part of the Draft Plan will lead to a significantly higher yield of housing outside of that provided for in Table 2.11. An assessment of the existing residential lands in the 2013-2019 plan period resulted in a yield from the existing residential lands of c.949 units. It is considered that the delivery of residential units on lands zoned existing residential will be low as development will be restricted to backlands and gap sites in existing residential areas. The expected number of units to be delivered has been accounted for as part of Table 2.11 and is consistent with the On foot of the above amended Table 2.11 and Section 2.8.2, further changes are required to the following sections
Vol. 1 Written Statement, Chapter 2- Core Strategy, Section 2.7 Refer to the Supplementary Amendments to Vol 1 for full list of changes detailed above. |
|
| Amendment No.: | Proposed Amendment Chapter 2.8 |
| Submission/ NOM/ (FTF) NOM Numbers |
MH-C5-816 |
| Chapter/Section |
Section 2.14.2 |
| Proposed Material Amendment | |
|
Insert the following objective in Section 2.14.2 ‘Core Strategy and SEA/AA Objectives’:
SH OBJ XX |
|
| Amendment No.: | Proposed Amendment Chapter 2.9 |
| Submission/ NOM/ (FTF) NOM Numbers |
MH-C5-816 |
| Chapter/Section |
Section 2.14.2 |
| Proposed Amendment as per CE Report | |
|
Amend the following objective in Section 2.14.2 ‘Core Strategy and SEA/AA Objectives’:
CS OBJ 7 |
|
| Amendment No.: | Proposed Amendment Chapter 2.10 |
| Submission/ NOM/ (FTF) NOM Numbers |
MH-C5-816 |
| Chapter/Section |
Section 2.14.2 |
| Proposed Material Amendment | |
|
Insert the following objective in Section 2.14.2 ‘Core Strategy and SEA/AA Objectives’:
CS OBJ XX |
|
| Amendment No.: | Proposed Amendment Chapter 2.11 |
| Submission/ NOM/ (FTF) NOM Numbers |
MH-C5-816 |
| Chapter/Section |
2.14.2 |
| Proposed Material Amendment | |
|
Insert the following objective in Section 2.14.2 ‘Core Strategy and SEA/AA Objectives’:
CS OBJ XX |
|
| Amendment No.: | Proposed Amendment Chapter 2.12 |
| Submission/ NOM/ (FTF) NOM Numbers |
MH-C5-816 |
| Chapter/Section |
2.14.2 |
| Proposed Material Amendment | |
|
Amend the following objectives in Section 2.14.2 ‘Core Strategy and SEA/AA Objectives’:
CS OBJ 10
|
|
| Amendment No.: | Proposed Amendment Chapter 2.13 |
| Submission/ NOM/ (FTF) NOM Numbers |
MH-C5-60 |
| Chapter/Section |
2.14.2 |
| Proposed Material Amendment | |
|
Insert the following objectives in Section 2.14.2 ‘Core Strategy and SEA/AA Objectives’:
CS OBJ XX |
|
| Amendment No.: | Proposed Amendment Chapter 2.14 |
|
Submission/ NOM/ (FTF) NOM Numbers |
MH-C5-629
Tom Phillips & Associates on behalf of Frank |
| Chapter/Section |
Core Strategy, Section 2.14.2 |
| Proposed Material Amendment | |
|
To amend CS OBJ 3 in Section 2.14.2 ‘Core Strategy and SEA/AA Objectives’:
CS OBJ 3 |
|
Clár ábhair
Tuairimí
Tuairimí
Please see attached
1. Cover Letter
2. Report from Marston Planning Consultancy
Please note that the material amendments indicated are non-exhaustive as the...
- The current lands (80 acres) identified for rezoning as public greenspace are perfect, this is a golden opportunity for our town. The park would be situated within 1.5 KM walking...
Please find attached TII's submission on Proposed Amendments to the Draft Meath County Development Plan, 2021 - 2027.