Proposed Amendment Chapter 2.7
Proposed Amendment Chapter 2.7
1. Amend Section 2.7 with the following text:
Section 2.7
-
To facilitate the population growth of Meath up to a projected population of
227,500228,300 in the plan period and ensure the distribution of this population is targeted towards the growth centres identified in the RSES.
2. Amend Section 2.8.1 and Table 2.4 as follows:
2.8.1 Guiding principles for Core Strategies
In its ‘Guiding Principles for Core Strategies’ the RSES requires Local Authorities to have regard to the settlement hierarchy in the preparation of the Core Strategy.17 There is also a recognition that the implementation of the Growth Strategy of the NPF at a regional and county level will result in inconsistencies with existing plans, particularly with regard to the quantum of land zoned for residential use.
The RSES provides the following options18 to address the issue of excess residential lands:
- Apply prioritisation measures which takes account of the sequential development of lands which are suitable for housing but may not be forthcoming in the plan period
- De-zone the land
There is also an acknowledgement that there are instances where there are settlements with long term development potential that are not being brought forward for development. Rather than being dependent on the release of these lands for residential development, the RSES indicates that Local Authorities should consider other suitable lands with better prospects for delivery in the short term whilst also pursuing the more strategic lands through an Active Land Management Strategy.
In identifying the residential land requirement for this Plan and addressing the issue of excess lands consideration will be given to both options set out above. An evaluation of all undeveloped residential lands in each settlement has been carried out. The prioritisation/phasing of residential lands will only be utilised in the larger settlements where population growth is to be concentrated i.e. Regional Growth Centre, Key Town, or Self-Sustaining Growth Towns and only where there are fundamental reasons which support the requirement to phase such lands.
It is proposed to include a reserve of residential lands that will not be available for development until after 20267 only in the following settlements:
|
Settlement |
Reason for including a reserve of residential land |
|
Dunboyne |
To ensure there is a long term strategy and to provide clarity as to the direction of future growth and development in the Metropolitan Town. |
|
Navan |
As the Key Town and the largest settlement in the County, it is important to have clarity and direction for the medium and long term growth of the town. In addition, the delivery of a rail line to Navan is a cross-cutting theme of this Plan. It is therefore integral to have a development strategy that demonstrates the town has the capacity to support the population increase associated with a rail based settlement. |
|
Dunshaughlin |
To demonstrate the town has the capacity to accommodate a critical mass of population associated with a rail link delivered as part of Phase II of the Navan Rail Project. |
|
Kilcock Environs |
To provide clarity in regard to the long term growth of this Metropolitan settlement. |
|
Enfield |
To provide clarity in regard to the long term growth of this multi-modal settlement. |
Table 2.4: List of settlements where a ‘reserve’ of residential lands is to be retained
17 Section 4.3 of the RSES ‘Defining a Settlement Typology’
18 Section 4.3 of the RSES ‘Taking Account of Existing Plans’
3. Amend Section 2.8.3 and Table 2.7 as follows:
2.8.3 Analysis of existing and projected growth rates
There was a rapid growth in population in Meath between 2006-11 when the population increased by 13%. During the following 5 year period (2011-16) a more moderate increase of 5.9% was recorded. This growth was reflective of the prevailing economic circumstances at the time whereby the national economy was performing strongly up to 2008, following which there was a curtailment of growth due to the global recession. Over the 10 year period between 2006-16 the total population increase was 20%. This equated to an annual average population increase of 3,221 persons.
|
|
|
|
|
|
|
|
|
|
|
|
Table 2.7 Population Growth in Meath 2006-2026
|
|
Population increase 2006-16 |
Average annual increase 2006-16 |
Projected increase 2016- 27 |
Projected annual average increase 2016-27 |
|
Meath |
32,206 |
3,221 |
33,256 |
3,023 |
Table 2.7 Population Growth in Meath 2006-2027
Between 2016-20267 it is projected that the population of Meath will increase by 16.5% 17.3%. This equates to an annual average population increase of 3,246 3,023 persons, which is equivalent to the annual average increase between 2006-16.
The graph above sets out the projected growth in the County up to 20267 and confirms that the pattern of growth will be along a similar trajectory as that experienced between 2006-16.
4. Amend Section 2.9.5 and Table 2.9 as follows:
2.9.5 Projecting Housing Demand up to 20267
As previously indicated, the absence of guidance at a national and regional level regarding projected household requirements and occupancy rates presents a significant challenge with regard to quantifying the total number of households and land required to meet the housing needs of the County during the Plan period.
For example, it is unclear as to whether or not it is anticipated that future occupancy rates will decline over the next decade following an increase between 2011-16. In addition it is difficult to quantify the additional housing required in the County to ‘catch up’ with demand.
The average occupancy rate gradually declined between 1996-2006 and began to increase during the recession. The improving economic conditions will facilitate in time a return to lower occupancy rates. For the purposes of this Core Strategy it is assumed that the average occupancy rate will decrease from 3 in 2016 to 2.5 in 20267.
Based on an average occupancy rate of 2.5 persons per household in 20267 and a population of 227,500 228,300 persons living in Meath in the same year, it is projected that the total housing stock in the County in 20267 would be 91,000 91,320 units. Vacancy rate has been factored in to this occupancy rate. This projection would result in a requirement for an additional 20,351 20,671 residential units in Meath over the 10 11 year period 2016-26 27.
This would equate to an annual average output of approximately 1,880 2,035 units per annum. This is not considered to be an unrealistic figure, particularly in the context of the anticipated housing requirements set out in the NPF and Rebuilding Ireland.27
|
|
|
|
|
|
|
|
|
|
|
|
|
|
|
|
Table 2.9: Projected household requirement in Meath up to 2026
|
Year |
2016 |
2027 |
|
Population |
195,044 |
228,300 |
|
Housing stock |
70,649 |
91,320 |
|
Increase from 2016 |
|
+20,671 |
Table 2.9: Projected household requirement in Meath up to 2027
27 Section 6.6 of the NPF ‘Housing’ indicates that between 2018 and 2040 an average ouput of 25,000 new homes will be required every year whilst Rebuilding Ireland seeks to increase the overall supply of new homes to 25,000 per annum by 2020.
5. Amend Section 2.9.6 and Table 2.10 as follows:
2.9.6 Securing Compact Growth
One of the underlying principles of the growth strategy in the NPF and RSES is securing more compact development. This is a continuation of the policy approach set out in the National Spatial Strategy and the Regional Planning Guidelines where there was a requirement for a sequential approach to be taken to the delivery of housing with priority given to the regeneration of infill/brownfield sites.
There is a target in the NPF and RSES to deliver at least 30% of all new homes in towns outside of the cities to be located ‘within and close to the existing built up area’ of settlements.28
This Plan recognises the social and economic benefits of the redevelopment of brownfield lands, particularly in relation to urban regeneration, and will continue to support the delivery of compact growth and the regeneration of under-utilised sites in towns and villages throughout the County.
An analysis of the potential capacity of infill and brownfield lands zoned for residential, town centre, or mixed use developments in all settlements indicates that approximately 6,272 units could be delivered on these lands. This equates to 31% of the household allocation for the County. The development of these lands will make an important contribution to the creation of more sustainable communities in the County and will support the implementation of the national and regional policy objectives of creating more compact settlements.
|
|
|
|
|
|
|
|
|
Table 2.10: Brownfield and Infill development targets
|
|
Potential capacity of lands |
|
Brownfield/Infil29 |
6,272 |
|
Greenfield |
14,309 |
Table 2.10: Brownfield and Infill development targets
28 National Policy Objective 3c of the NPF and Regional Policy Objective 3.2 of the RSES
29 This includes greenfield sites in the ‘existing built up area of settlements’
29 This includes greenfield sites in the ‘existing built up area of settlements’
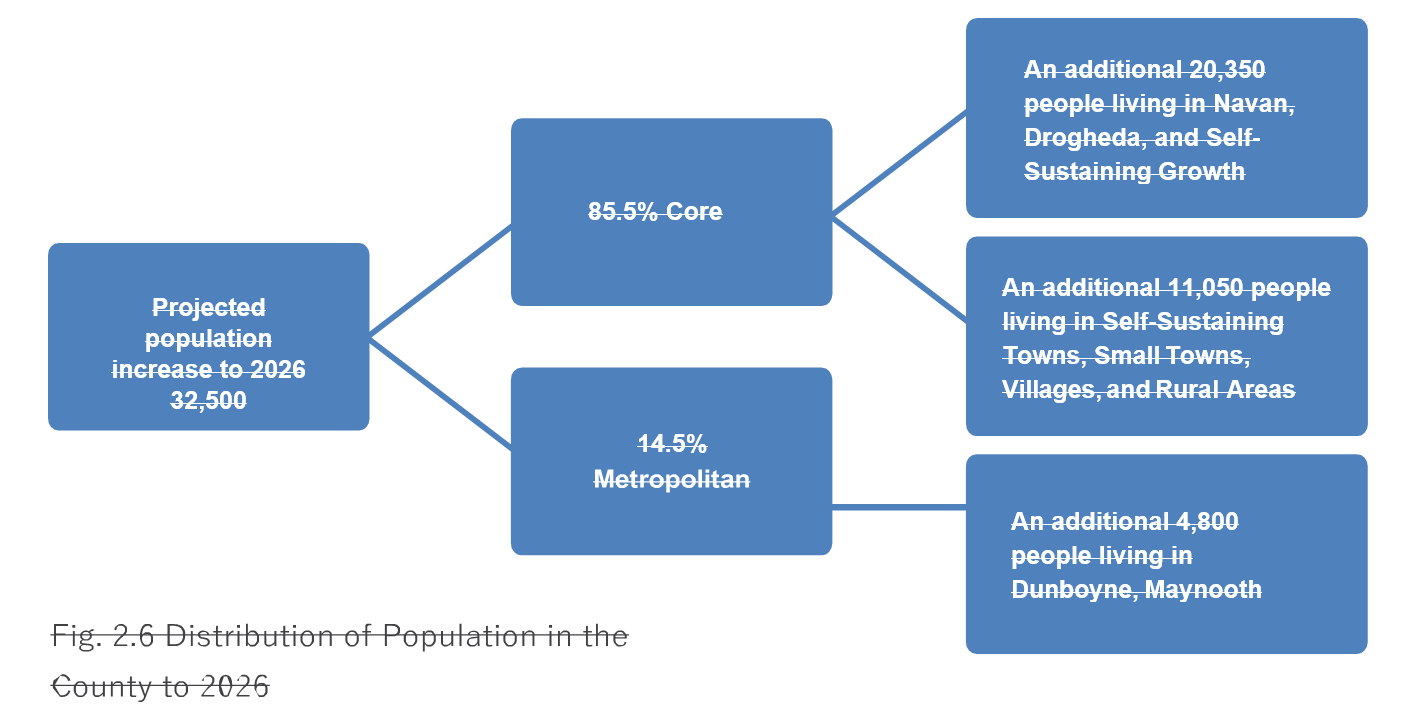
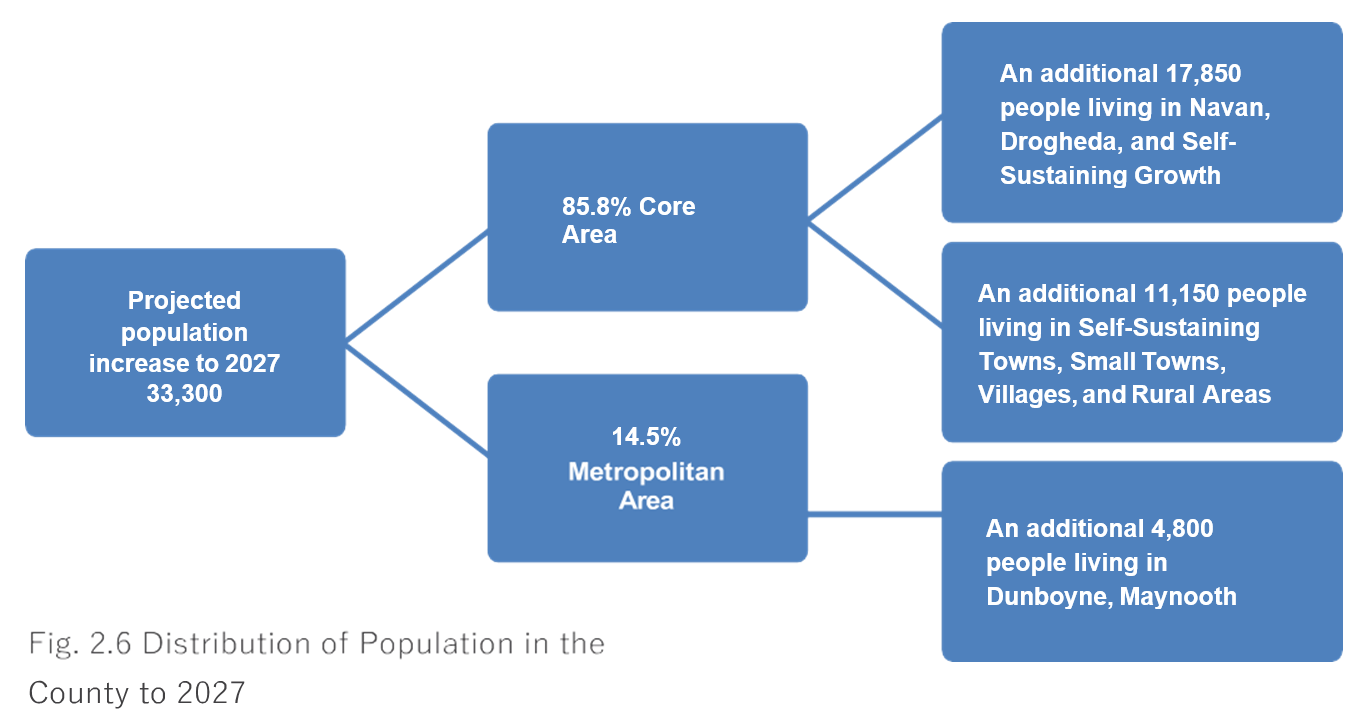
6. Amend Section 2.10.4 and Fig 2.6 as follows:
2.10.4 Distribution of Population and Households in the County
Table 2.11, the ‘Core Strategy Table’, sets out the population projections and household allocation for each settlement up to 20267.This table provides details of the most recent population, population projections, the development activity in
each settlement between 2016-2019, the number of unbuilt permitted units, and the household allocation for each settlement between 2020-2026 2027.
The multi-faceted nature of settlement growth and the various socio-economic factors associated with the growth of towns and villages makes it extremely challenging to provide an exact figure for a population to grow to at a specific time. Rather than focusing on the population projection as a ‘target’ the figures provided in Table 2.11 should be regarded as a guide as to the level of growth anticipated in that settlement during the plan period. The emphasis will instead be on the delivery of the objectives of the NPF and RSES, and in particular the creation of balanced, sustainable growth.
It is acknowledged that due to various circumstances there are some settlements that may grow at a rate faster than anticipated and others which will develop at a slower rate. As part of the monitoring and implementation process of this Plan the Council will analyse settlement growth within the County, particularly following the publication of Census 2021 data data from the next census. This exercise will form a significant element of the formal 2 year statuory review.
As part of the strategy of securing compact growth, an analysis of the potential number of units that could be delivered in the built up area of each settlement was carried out. This figure is set out in column H of the table. This includes lands zoned as ‘New Residential’, ‘Existing Residential’, Mixed Use’, or ‘Town Centre’ uses. The quantum of lands zoned ‘New Residential’ in each settlement has also been provided.
The total household allocation for the County between 2016-2026 is 20,351 20,671 units. Approximately 3,682 3,713 units were constructed between 2016-2019 (see column E), leaving an allocation of 16,669 16,958 units to be built during the Plan period 2020-2026 (column G).
Volume 2 of this Plan includes a Written Statement and zoning map for each settlement in the County. These Written Statements set out the strategy as to how the core strategy will be implemented in each of these settlements.36
Chapter 9 sets out the relevant policies and objectives in respect of residential development in rural nodes and the open countryside.
36 Following the adoption of this Plan it is intended to prepare a Local Area Plan for each of the following settlements: Navan, Dunboyne/Clonee, Ashbourne, Trim, Kells, Laytown/Bettystown/Mornington/Donacarney, Dunshaughlin, Duleek, Enfield, Stamullen and Ratoath. A Joint Local Area Plan for Maynooth is to be prepared with Kildare, a Joint Urban Plan is to be prepared for Drogheda.
7. Amend Table 2.12 as follows:
|
|
|
|
|
|
|
|
|
|
|
|
|
|
|
|
|
|
|
|
|
|
|
|
|
|
|
|
|
|
|
|
|
|
|
|
|
|
|
|
|
|
|
|
|
|
|
|
|
Table 2.12: Summary of population and household distribution in each settlement category
43 Does not include the units completed 2016-2019
|
Settlement |
Projected population increase to 2027 |
% of total population growth |
Approximate households completed 2016-2019 |
Household allocation 2020-202743 |
Quantum of land zoned for residential use (ha) |
|
Regional Growth Centre |
3,300 |
9.76% |
113 |
1,631 |
178.73 |
|
Key Towns |
6,900 |
20.41% |
781 |
3704 |
100.97 |
|
Self- Sustaining Growth Towns |
11,95 0 |
35.36% |
1,278 |
6139 |
199.33 |
|
Self- Sustaining Towns |
5,500 |
16.27% |
910 |
2829 |
99.55 |
|
Small Towns |
1,000 |
2.96% |
86 |
510 |
29.32 |
|
Villages, Rural Nodes, and Open Countryside |
5,150 |
15.24% |
494 |
2176 |
51.46 |
Table 2.12: Summary of population and household distribution in each settlement category
43 Does not include the units completed 2016-2019